

SSRS - Matrix Control
In SQL Reporting Services, the Matrix control provides a crosstab view of data, similar in behavior to a PivotTable. Rows and columns will have intersecting points of data which is often useful in time based reporting.
Matrix components are great for visualizing data that might normally be exported to Excel, or in a Pivot Table. Year over year analysis is a good example. But if an analyst wants to view monthly sales, year over year, then he'd need to add some custom sorting so the months line up as expected. Additionally, we don't want to add the values between years, we instead need to display a difference in the totals, and perhaps in percentage growth (or decline).
To add a matrix
Open the client report definition (.rdlc) file in graphical design mode. In the Toolbox, click Matrix. Click the design surface of the report.

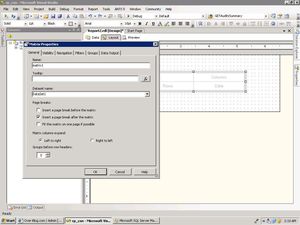
After the matrix is on the report, you can move it by pointing to the shaded border of the matrix and dragging it to a new location. When you first create a matrix, the matrix displays four cells. The upper-left cell is the corner cell. You can use the corner cell to display a label for the matrix, or you can leave it empty. The upper-right cell is a column header, which can contain a field or expression by which to group the data. The lower-left cell is a row header, which also can contain a field or expression by which to group the data. The lower-right cell contains an aggregate expression for the detail data.
After you add a matrix, you can add fields to the matrix. Each cell in the matrix contains a text box by default. You can type any expression into any cell, or you can change the item within the cell to another item (i.e. to Image ot Chart).
Each matrix on a report is associated with a dataset. If the report contains a single dataset, the matrix is automatically associated with that dataset when you place it on the report. If the report contains multiple datasets, you must associate the matrix with the correct dataset.
Here I had taken Dataset for the Slaes on each Item for every year. the result of the Dataset is like
Item Year Sales
Item1 2007 150
Item2 2007 200
Item1 2008 180
Item2 2008 160
Item3 2007 510
Item3 2008 320
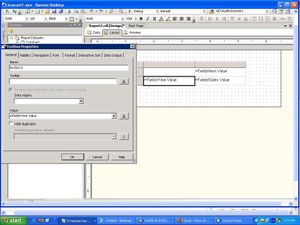
After Adding the Required Dataset set to the Matrix control, you need to set the Column Grouping and Row Grouping Fields for Cross tab


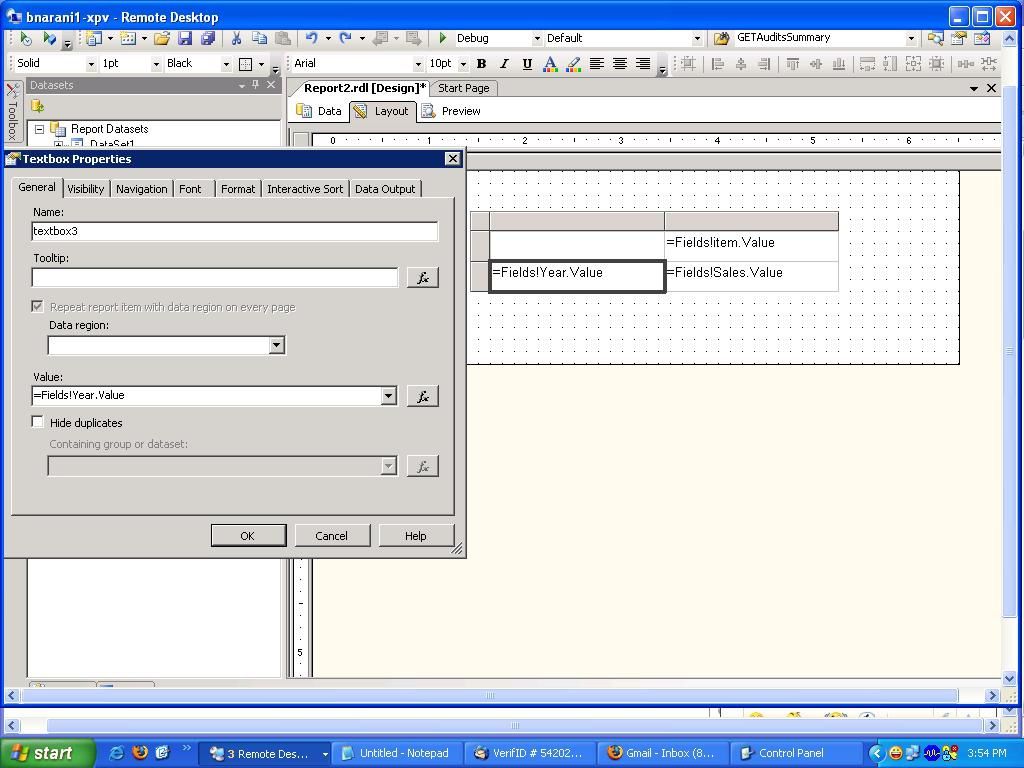
Add the required Fileds to Column Header, and Row Header in the Matrix Control and also the Aggregate Expression to display the Data. to set these fileds, Right clikc on the each textbox (i.e. Header Group, Row group and Data), select the properties and set Fileds Name.
Here I added Year for Column Header, Item for Header, Aggregate function like Sum of the Sales to the Data textbox
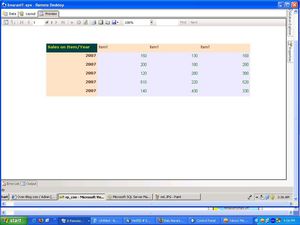
Here, we can set the different Colours to each section of the Matrix control. select the every textbox and set the Colour font nad etc.. from its properties explorer, and see the preview of the report.

Adding Total's to Cross tab
In the matrix control we can also add the Sub total to each Column on and Each Row.
It shows like Total Items Sales in the every Row, and it shows Total Sales for every Year.
Select the Column Header and right click on the Header, here you can get the Sub Total in the Right Click Context menu, do the same above for Row Header also.


After adding the Subtotal to the Matrix, see the preview of the report, it looks like below.

-- Advanced Matrix Control next...
Matrix components are great for visualizing data that might normally be exported to Excel, or in a Pivot Table. Year over year analysis is a good example. But if an analyst wants to view monthly sales, year over year, then he'd need to add some custom sorting so the months line up as expected. Additionally, we don't want to add the values between years, we instead need to display a difference in the totals, and perhaps in percentage growth (or decline).
To add a matrix
Open the client report definition (.rdlc) file in graphical design mode. In the Toolbox, click Matrix. Click the design surface of the report.

After the matrix is on the report, you can move it by pointing to the shaded border of the matrix and dragging it to a new location. When you first create a matrix, the matrix displays four cells. The upper-left cell is the corner cell. You can use the corner cell to display a label for the matrix, or you can leave it empty. The upper-right cell is a column header, which can contain a field or expression by which to group the data. The lower-left cell is a row header, which also can contain a field or expression by which to group the data. The lower-right cell contains an aggregate expression for the detail data.
After you add a matrix, you can add fields to the matrix. Each cell in the matrix contains a text box by default. You can type any expression into any cell, or you can change the item within the cell to another item (i.e. to Image ot Chart).
Each matrix on a report is associated with a dataset. If the report contains a single dataset, the matrix is automatically associated with that dataset when you place it on the report. If the report contains multiple datasets, you must associate the matrix with the correct dataset.
Here I had taken Dataset for the Slaes on each Item for every year. the result of the Dataset is like
Item Year Sales
Item1 2007 150
Item2 2007 200
Item1 2008 180
Item2 2008 160
Item3 2007 510
Item3 2008 320

After Adding the Required Dataset set to the Matrix control, you need to set the Column Grouping and Row Grouping Fields for Cross tab
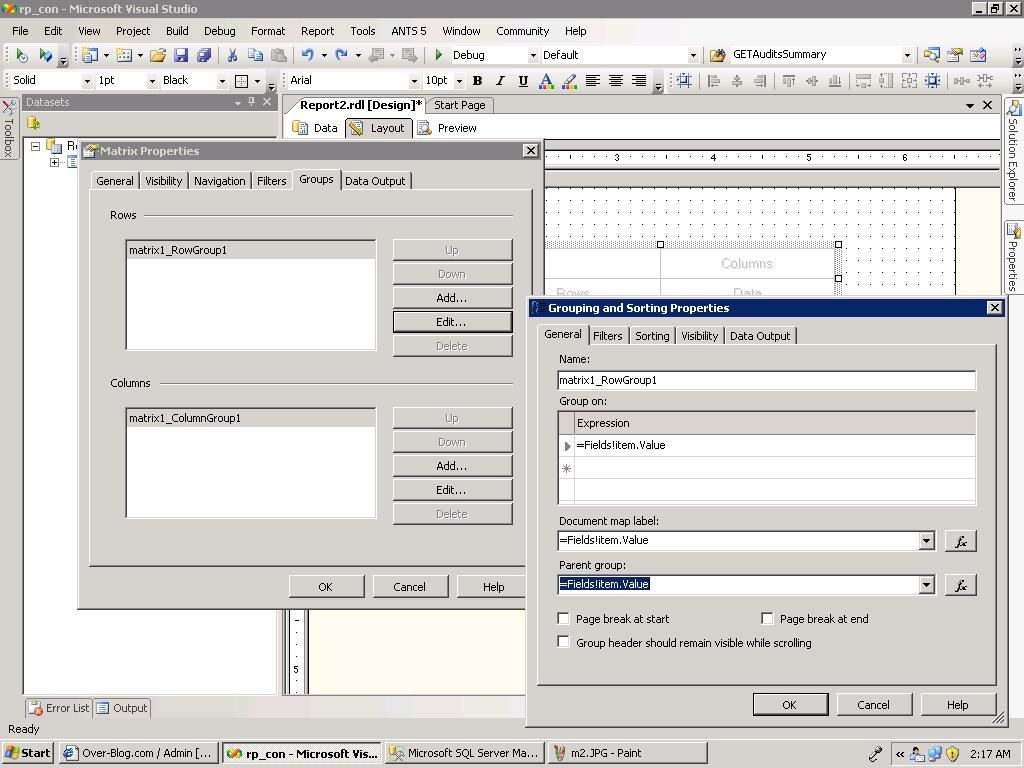
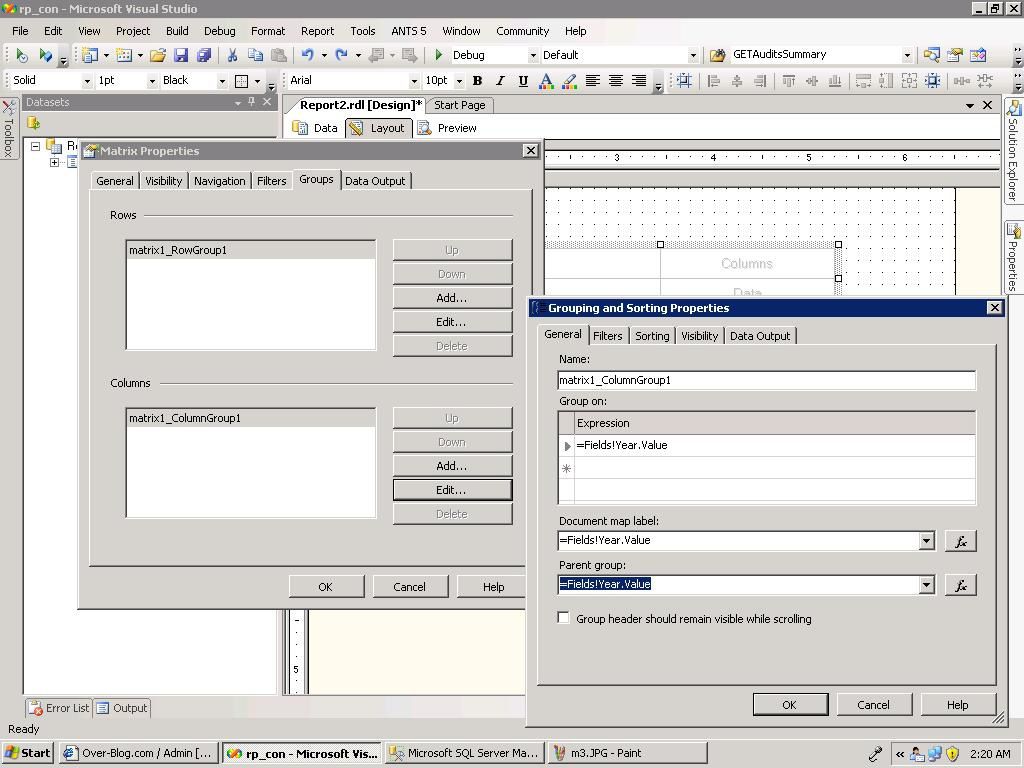
Add the required Fileds to Column Header, and Row Header in the Matrix Control and also the Aggregate Expression to display the Data. to set these fileds, Right clikc on the each textbox (i.e. Header Group, Row group and Data), select the properties and set Fileds Name.
Here I added Year for Column Header, Item for Header, Aggregate function like Sum of the Sales to the Data textbox
Here, we can set the different Colours to each section of the Matrix control. select the every textbox and set the Colour font nad etc.. from its properties explorer, and see the preview of the report.


Adding Total's to Cross tab
In the matrix control we can also add the Sub total to each Column on and Each Row.
It shows like Total Items Sales in the every Row, and it shows Total Sales for every Year.
Select the Column Header and right click on the Header, here you can get the Sub Total in the Right Click Context menu, do the same above for Row Header also.


After adding the Subtotal to the Matrix, see the preview of the report, it looks like below.

-- Advanced Matrix Control next...
Share this post


To be informed of the latest articles, subscribe:
/idata%2F2707821%2FSSRS%2Fm11.JPG)
/idata%2F2707821%2FSSRS%2F1.JPG)
/idata%2F2707821%2Fimage_ssrs_arc.jpg)
/https%3A%2F%2Fassets.over-blog.com%2Ft%2Fcedistic%2Fcamera.png)
Comment on this post
C
C
R
P
F
